The feature is supported in RadonDB MySQL Kubernetes 2.1.0 and later versions.
Background
The text-based format for exposing metrics required by Prometheus has been a standard in cloud-native monitoring.
The RadonDB MySQL monitoring engine is based on Prometheus MySQLd Exporter. It scrapes RadonDB MySQL metrics with mysqld-exporter and visualizes the metrics by third-party platforms.
This section displays how to enable RadonDB MySQL monitoring metrics.
Prerequisites
- A Kubernetes or KubeSphere cluster
- RadonDB MySQL Kubernetes 2.1.0 or a later version
Procedure
Step 1 Configure serviceMonitor.
serviceMonitor is a parameter defining the automatic monitoring engine of RadonDB MySQL Operator. It is automatically bound to mysqld_exporter and Prometheus automatically after being enabled.
The serviceMonitor parameter contains:
serviceMonitor:
  enabled: true
  ## Additional labels for the serviceMonitor. It is useful when you have multiple Prometheus operators running to select specific ServiceMonitors.
  # additionalLabels:
  #   prometheus: prom-internal
  interval: 10s
  scrapeTimeout: 3s
  # jobLabel:
  # targetLabels:
  # podTargetLabels:
  namespaceSelector:
    any: true
  selector:
    matchLabels:
      app.kubernetes.io/managed-by: mysql.radondb.com
      app.kubernetes.io/name: mysql
You can configure serviceMonitor in the charts/mysql-operator/values.yaml file.
- When a new Operator is deployed,
serviceMonitor.enabledis set totrueby default. The serviceMonitor is enabled. - If the Operator deployed for the cluster is earlier than version 2.1.0, you need to redeploy a later version of Operator.
Step 2 Configure metricsOpts.
metricsOpts is a parameter defining the RadonDB MySQL cluster monitoring. You can enable the monitoring service by configuring the parameter in the mysql_v1alpha1_mysqlcluster.yaml file.
metricsOpts parameter contains:
metricsOpts:
    enabled: false
    image: prom/mysqld-exporter:v0.12.1

    resources:
      requests:
        cpu: 10m
        memory: 32Mi
      limits:
        cpu: 100m
        memory: 128Mi
metricsOpts.enabled is set to false by default. You can set it to true manually.
- To enable cluster monitoring function, set
metricsOpts.enabledtotrue. - To define the resource quota for monitoring containers, set the
resourcesparameter.
Apply the configuration as follows and the following information is displayed.
$ kubectl apply -f config/sample/mysql_v1alpha1_mysqlcluster.yaml
cluster.mysql.radondb.com/sample created/configured
Viewing monitoring services
Viewing on Client
You can view the cluster monitoring service and information of serviceMonitor as follows.
$ kubectl get service,servicemonitor

$ kubectl describe servicemonitor <serviceName>
Expected output
$ kubectl get service,servicemonitor
NAME                             TYPE        CLUSTER-IP      EXTERNAL-IP   PORT(S)    AGE
service/mysql-operator-metrics   ClusterIP   10.96.242.205   <none>        8443/TCP   3h25m
service/sample-follower          ClusterIP   10.96.2.234     <none>        3306/TCP   21h
service/sample-leader            ClusterIP   10.96.30.238    <none>        3306/TCP   21h
service/sample-metrics           ClusterIP   10.96.7.222     <none>        9104/TCP   3h24m
service/sample-mysql             ClusterIP   None            <none>        3306/TCP   21h

NAME                                                              AGE
servicemonitor.monitoring.coreos.com/demo-mysql-operator          3h25m

$ kubectl describe servicemonitor demo-mysql-operator
Name:         test-radondb-mysql-metrics
Namespace:    default
Labels:       app=test-radondb-mysql
              app.kubernetes.io/managed-by=Helm
              app.kubernetes.io/vendor=kubesphere
              chart=radondb-mysql-1.0.0
              heritage=Helm
              release=test
Annotations:  kubesphere.io/creator: admin
API Version:  monitoring.coreos.com/v1
Kind:         ServiceMonitor
......
Spec:
  Endpoints:
    Interval:        1m
    Path:            /metrics
    Port:            metrics
    Scheme:          http
    Scrape Timeout:  10s
......
Viewing on KubeSphere
After the monitoring is enabled, you can view the status of the monitoring service for RadonDB MySQL Operators and clusters deployed in Kubesphere workspace.
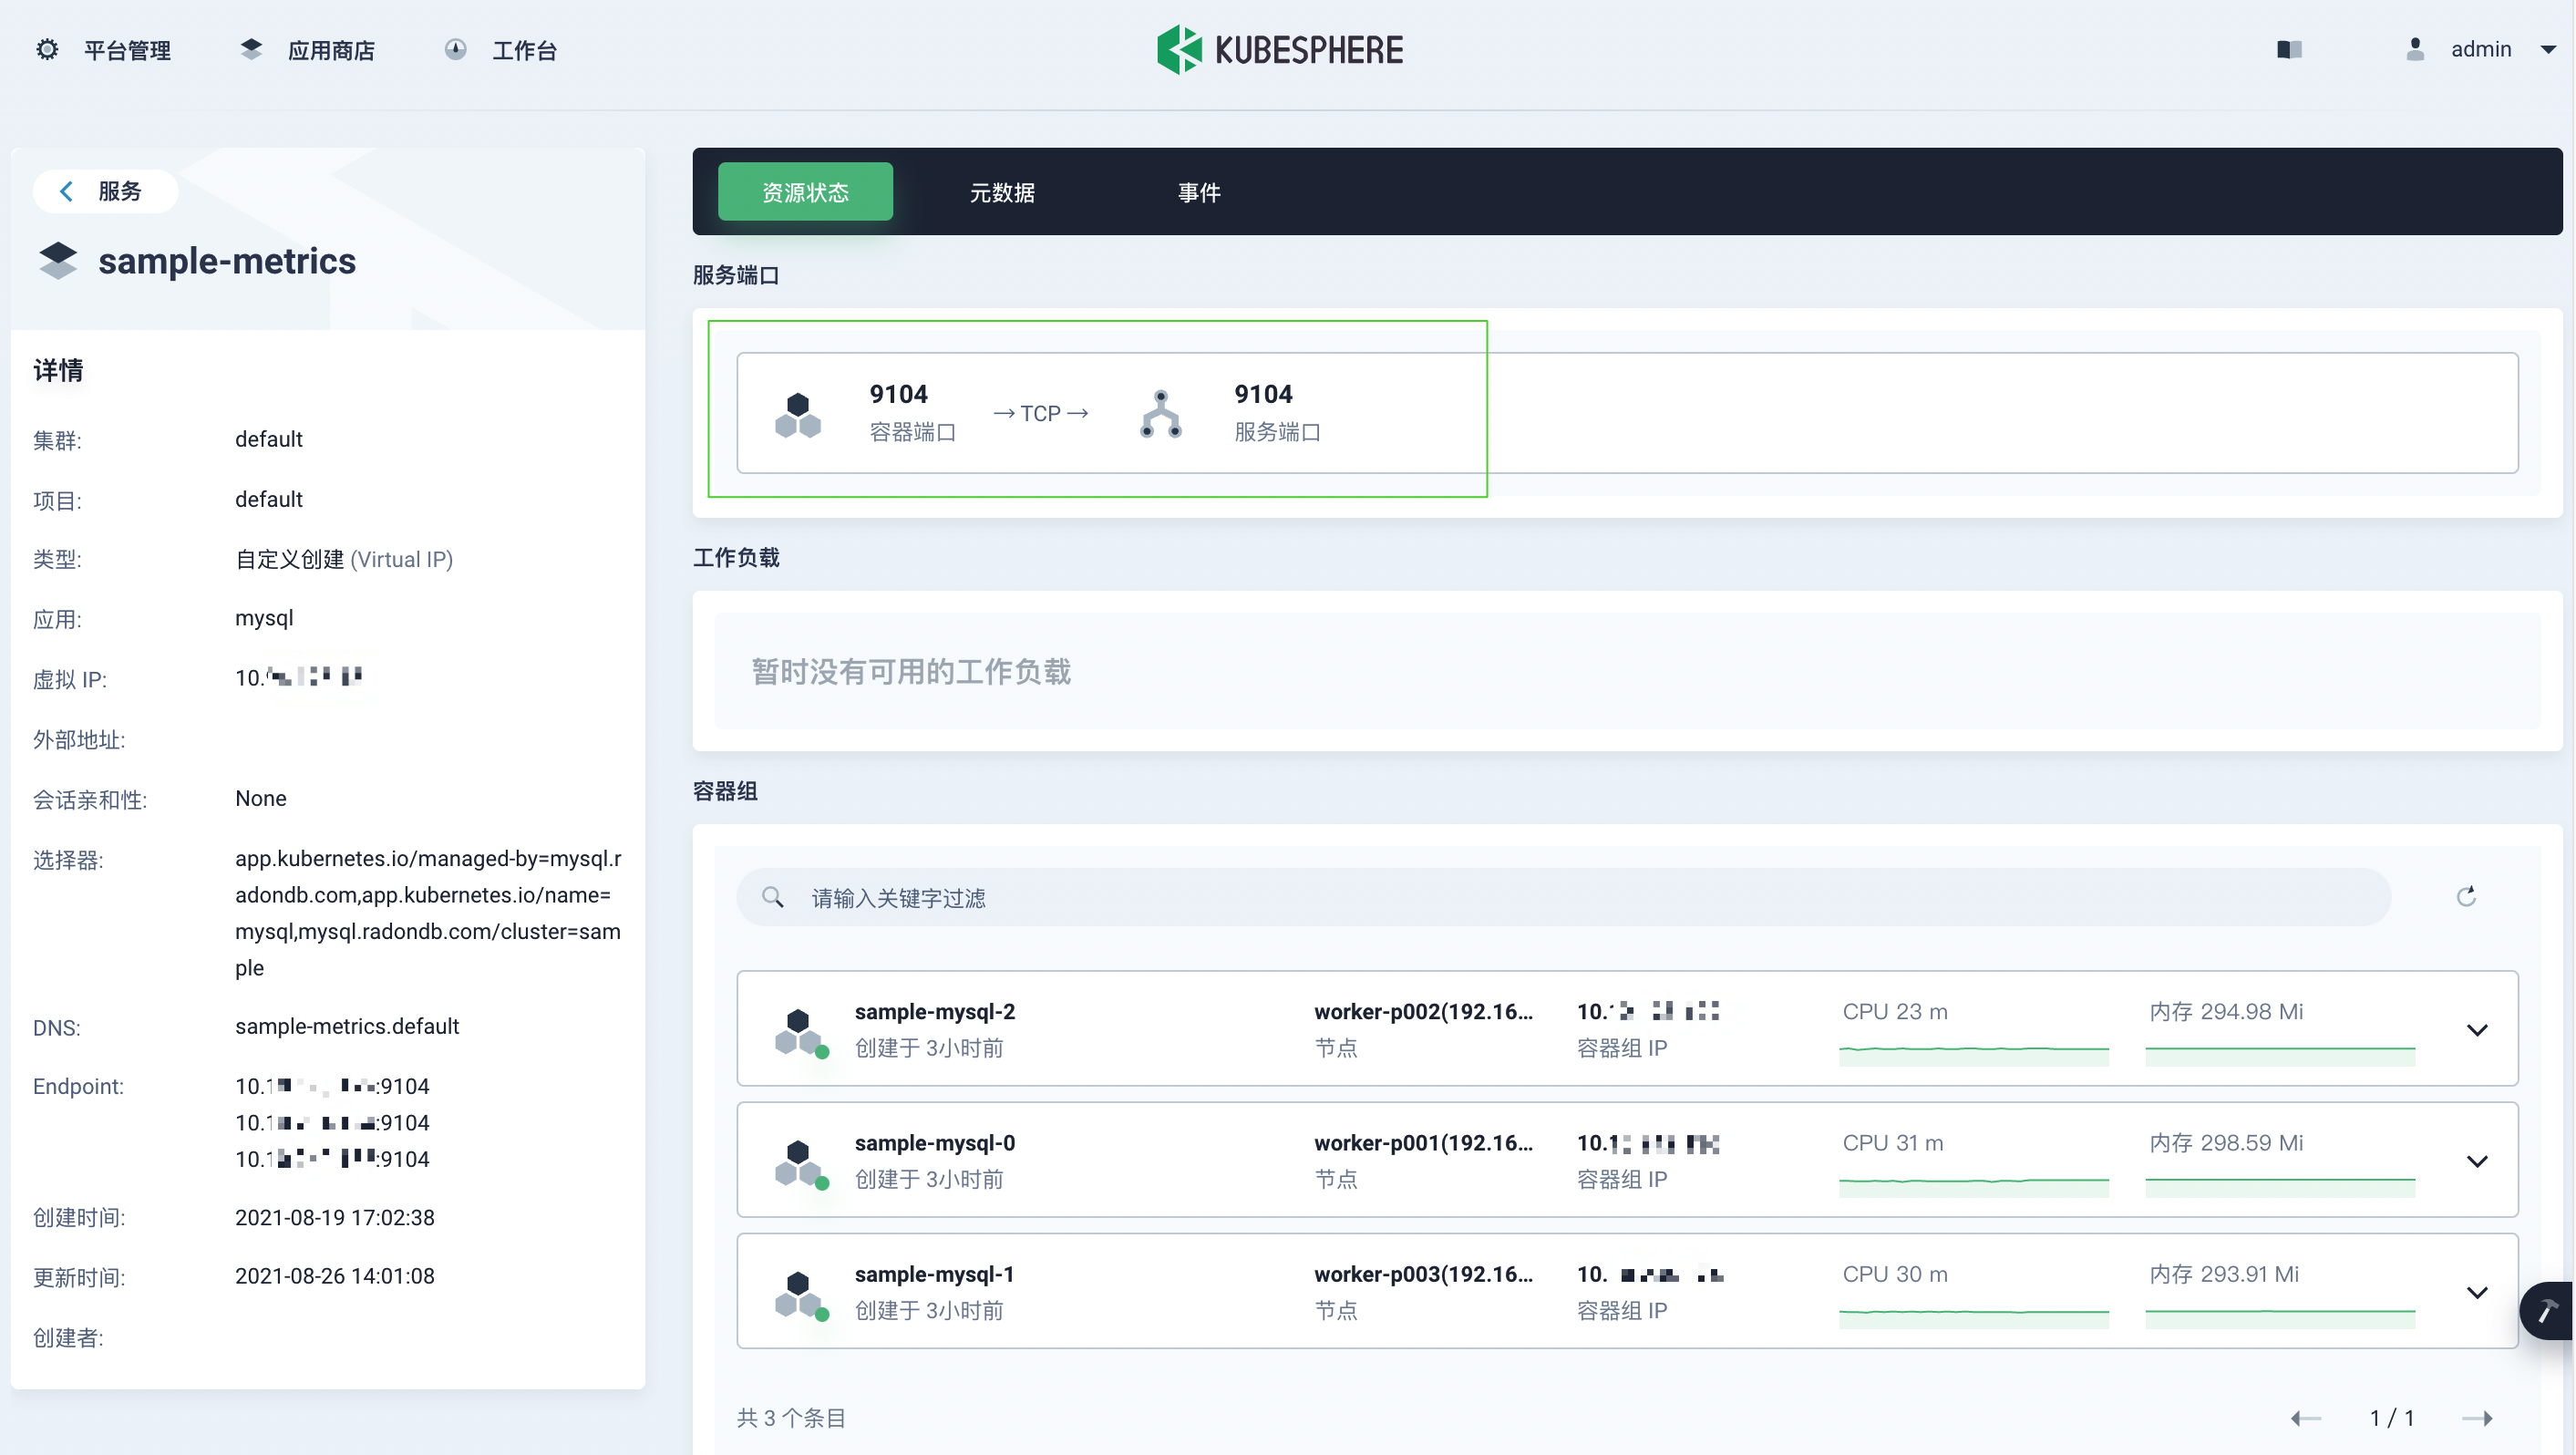
- On the service page under Application Load in the project space, click
< clusterName>-metricsto view the monitoring service details.
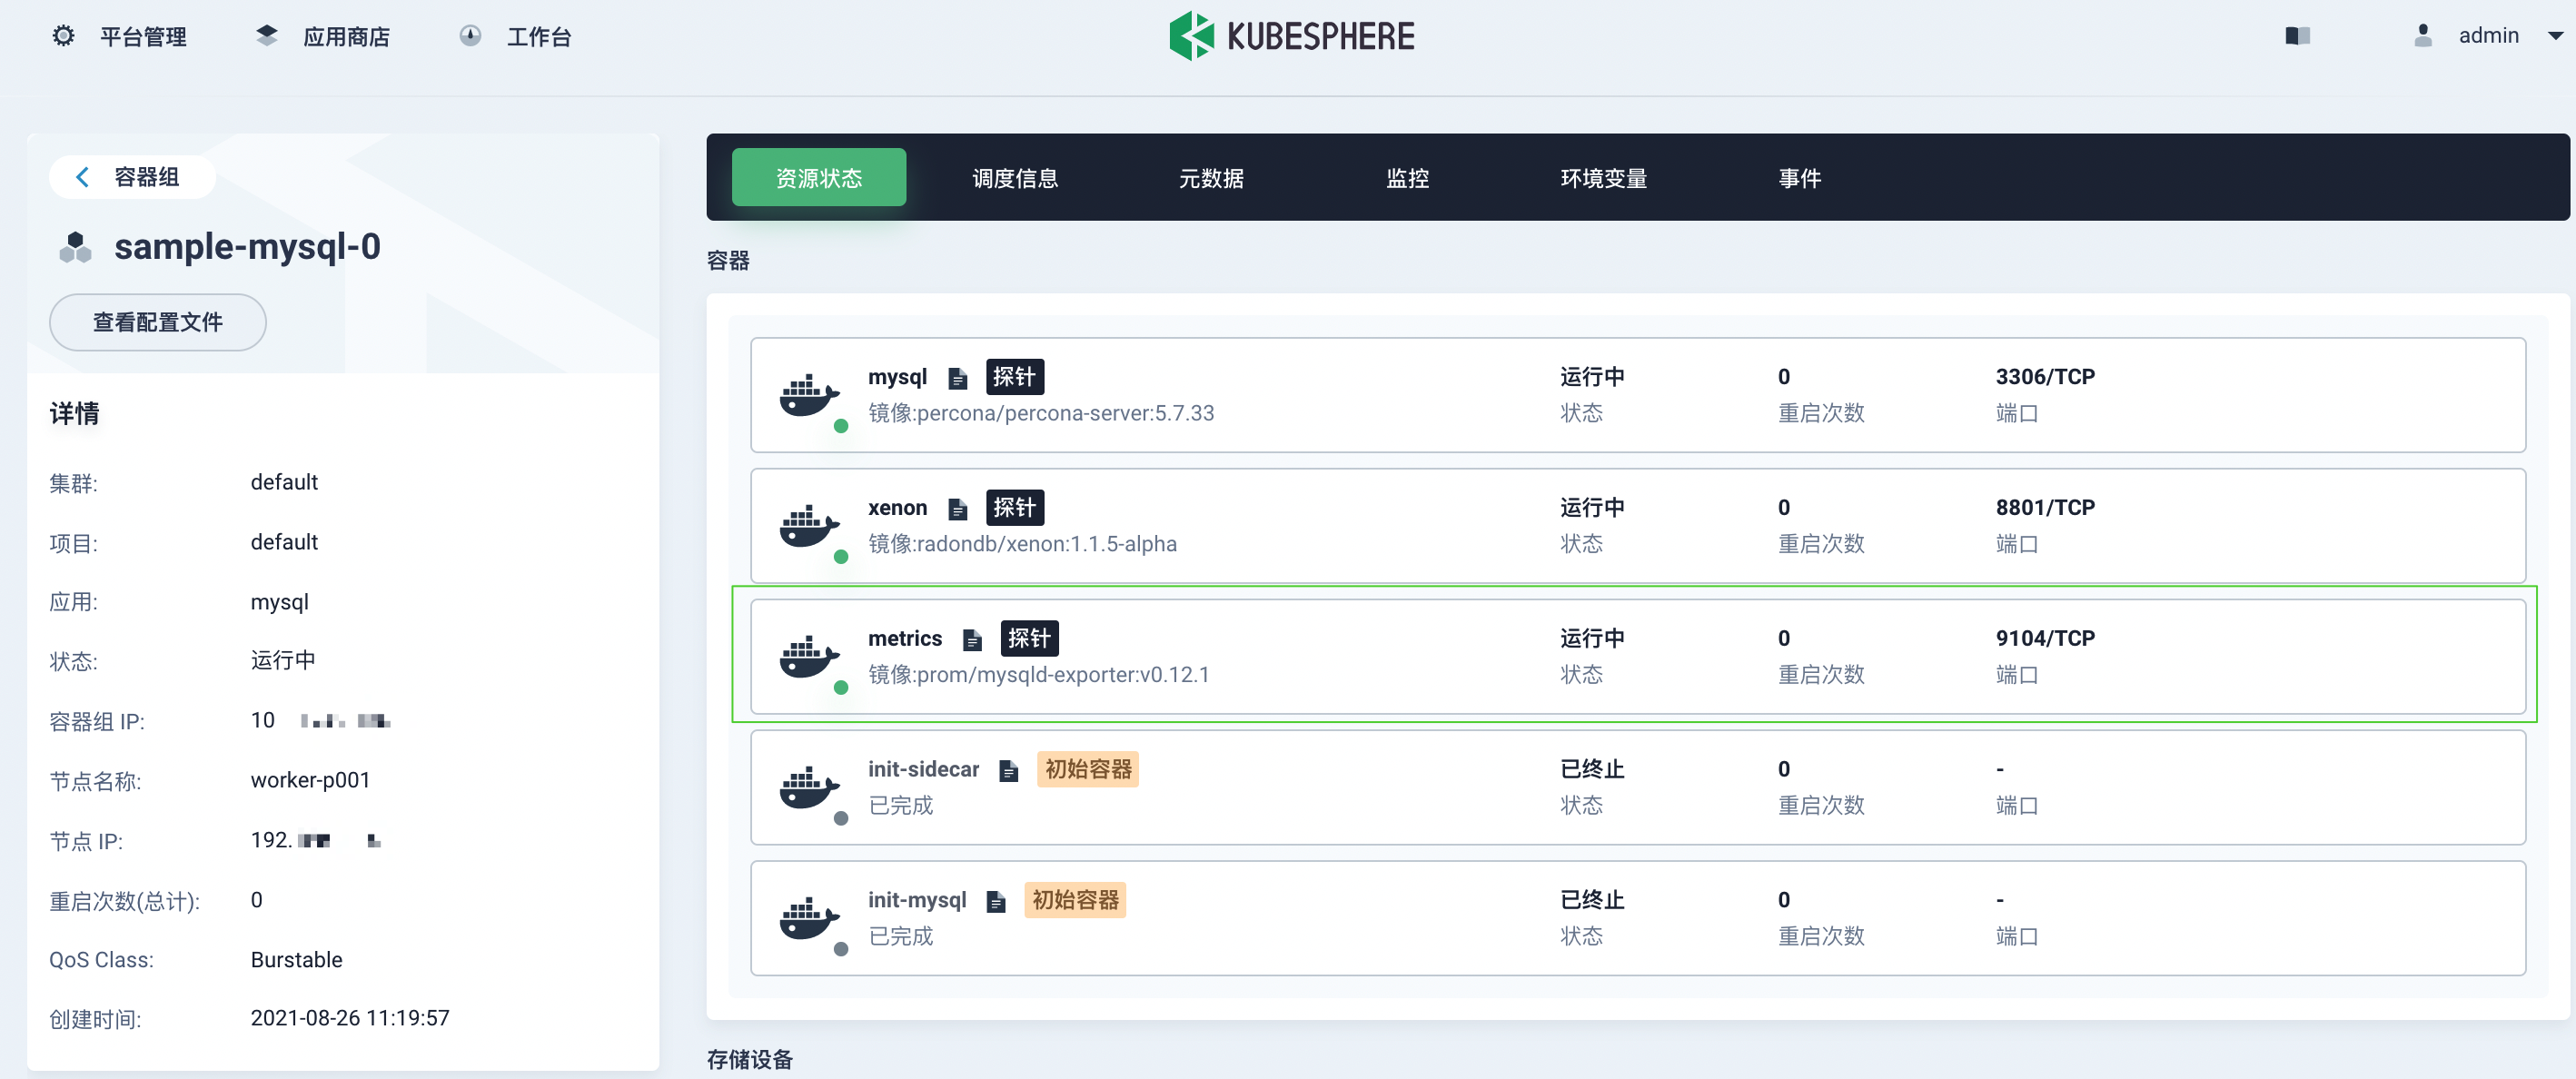
- On the Container Group page under Application Load in the project space, click a container name to view the status of
metricsresources in the container.
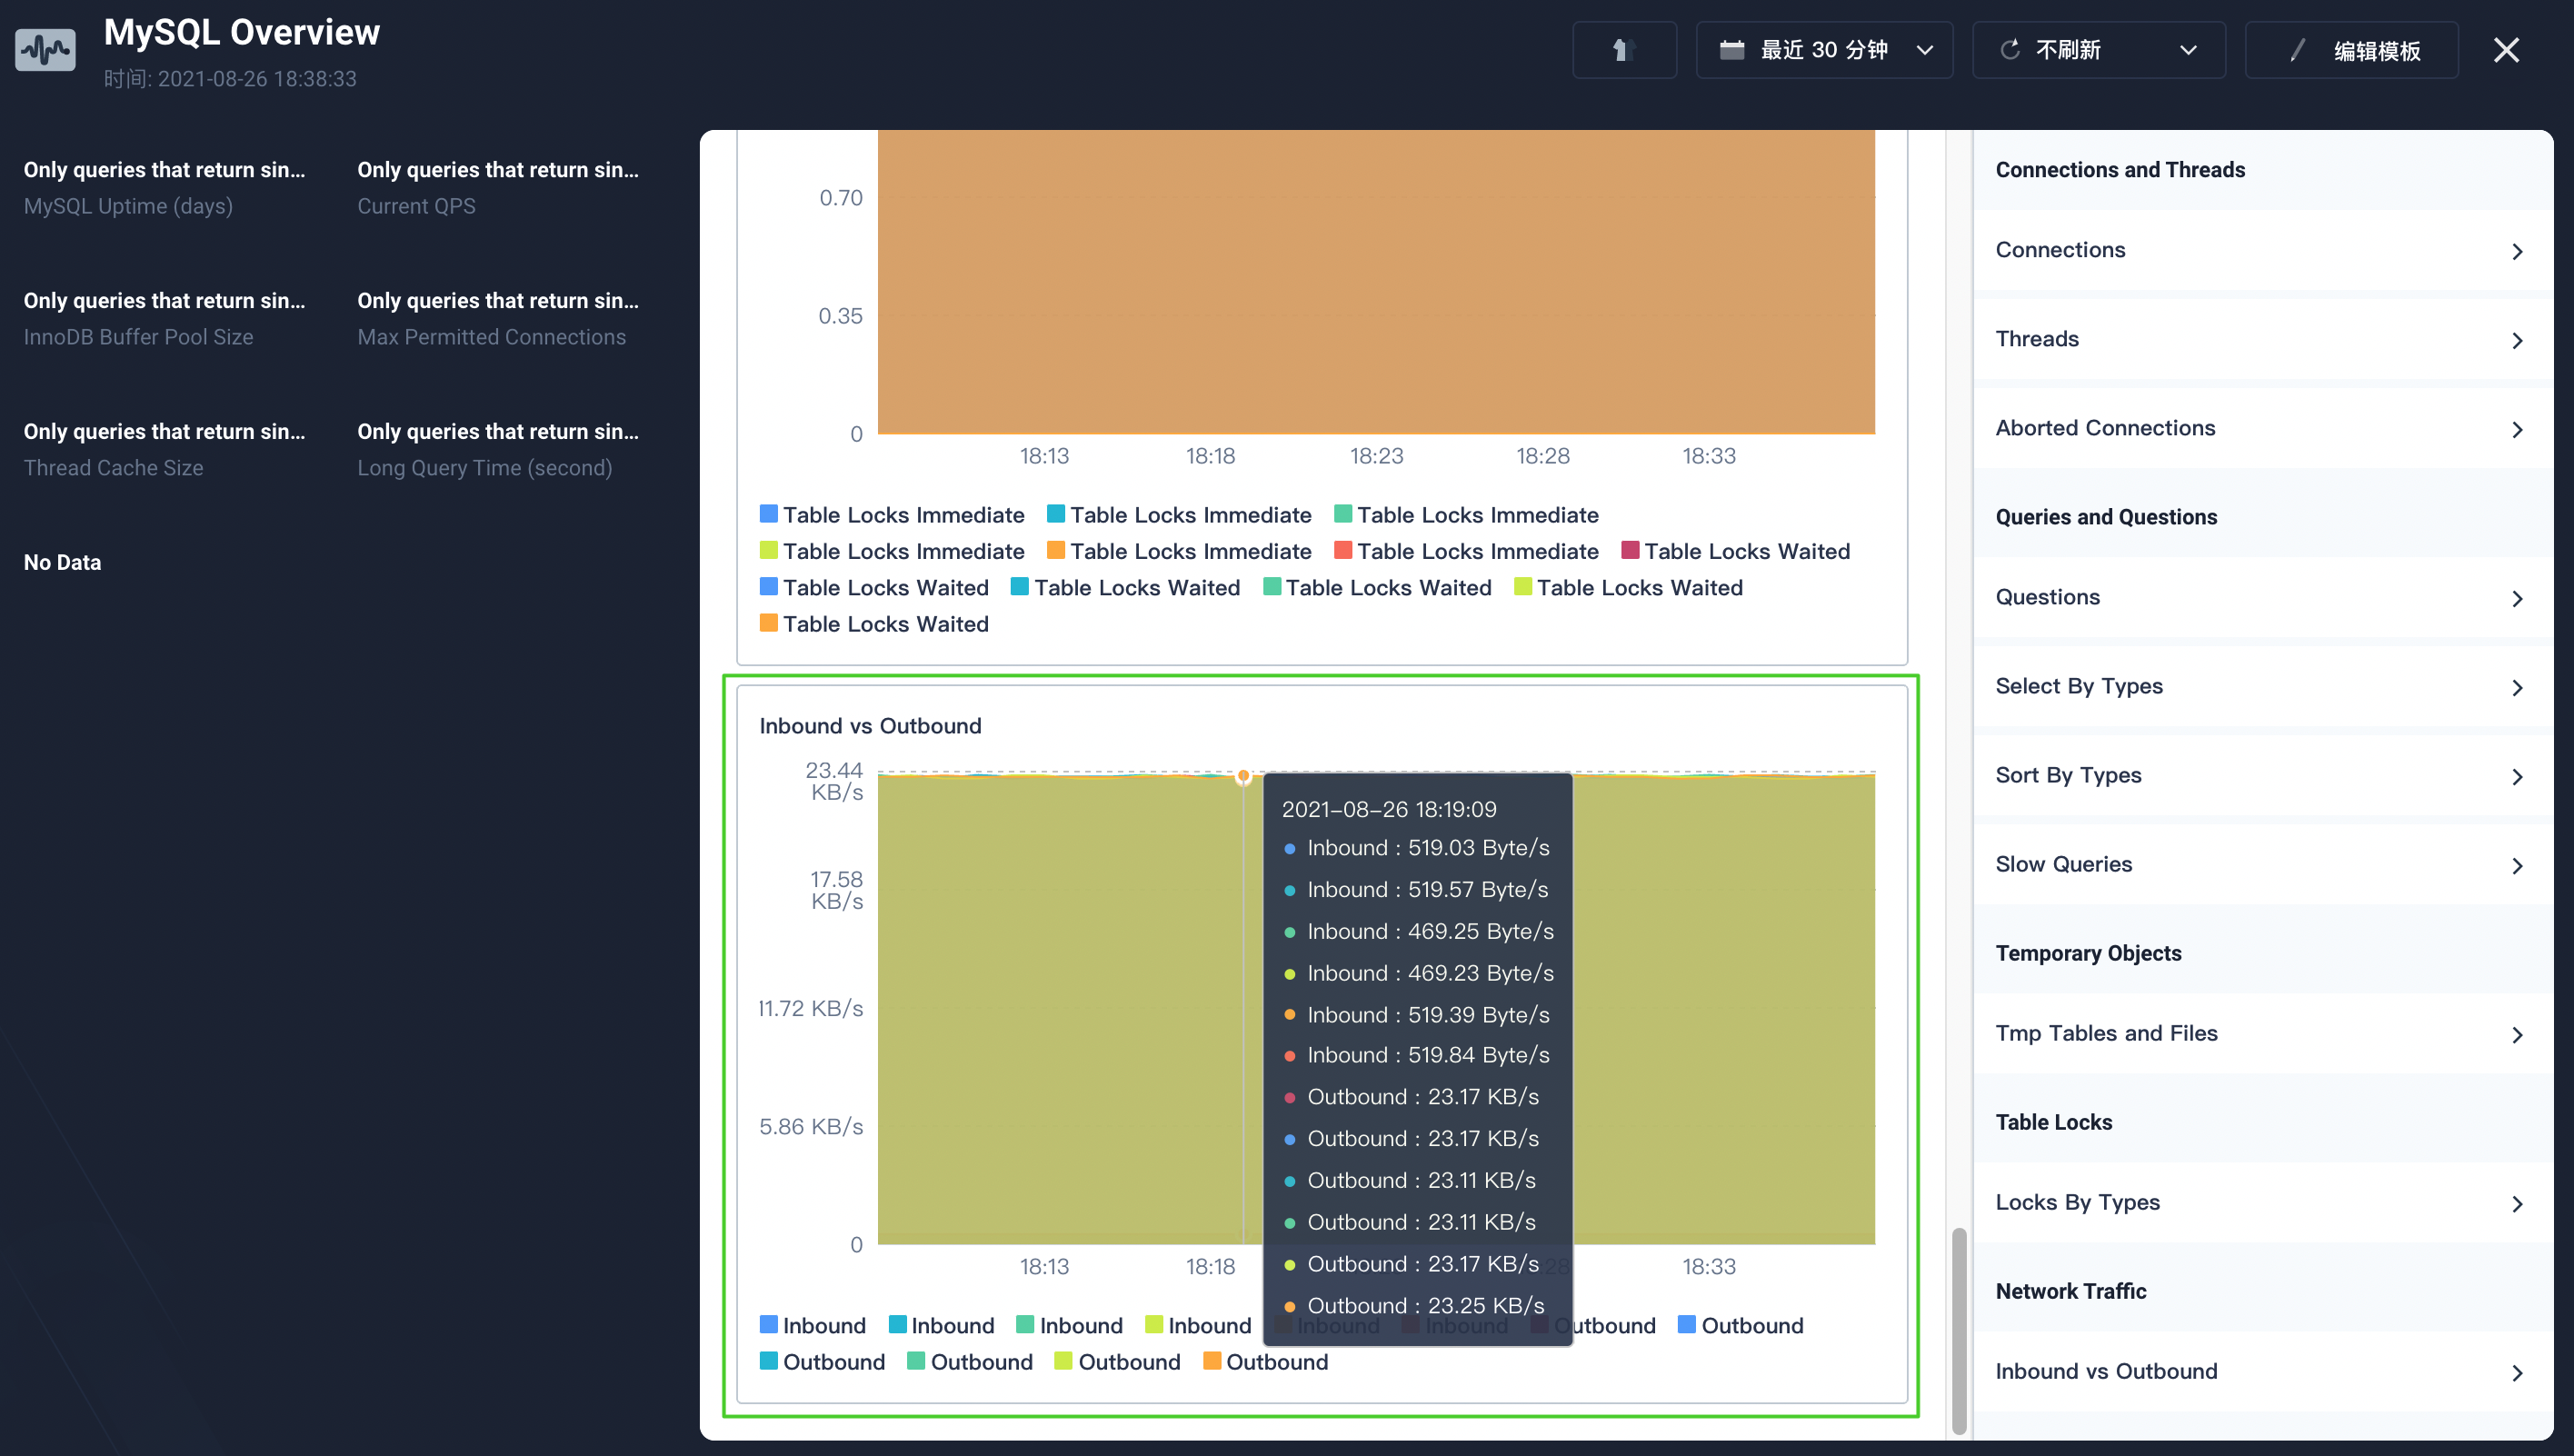
Viewing monitoring data
Custom monitoring on Kubesphere
The Kubesphere monitoring engine is based on Prometheus and Prometheus Operator. Kubesphere’s custom monitoring allows you to monitor and visualize RadonDB MySQL metrics.
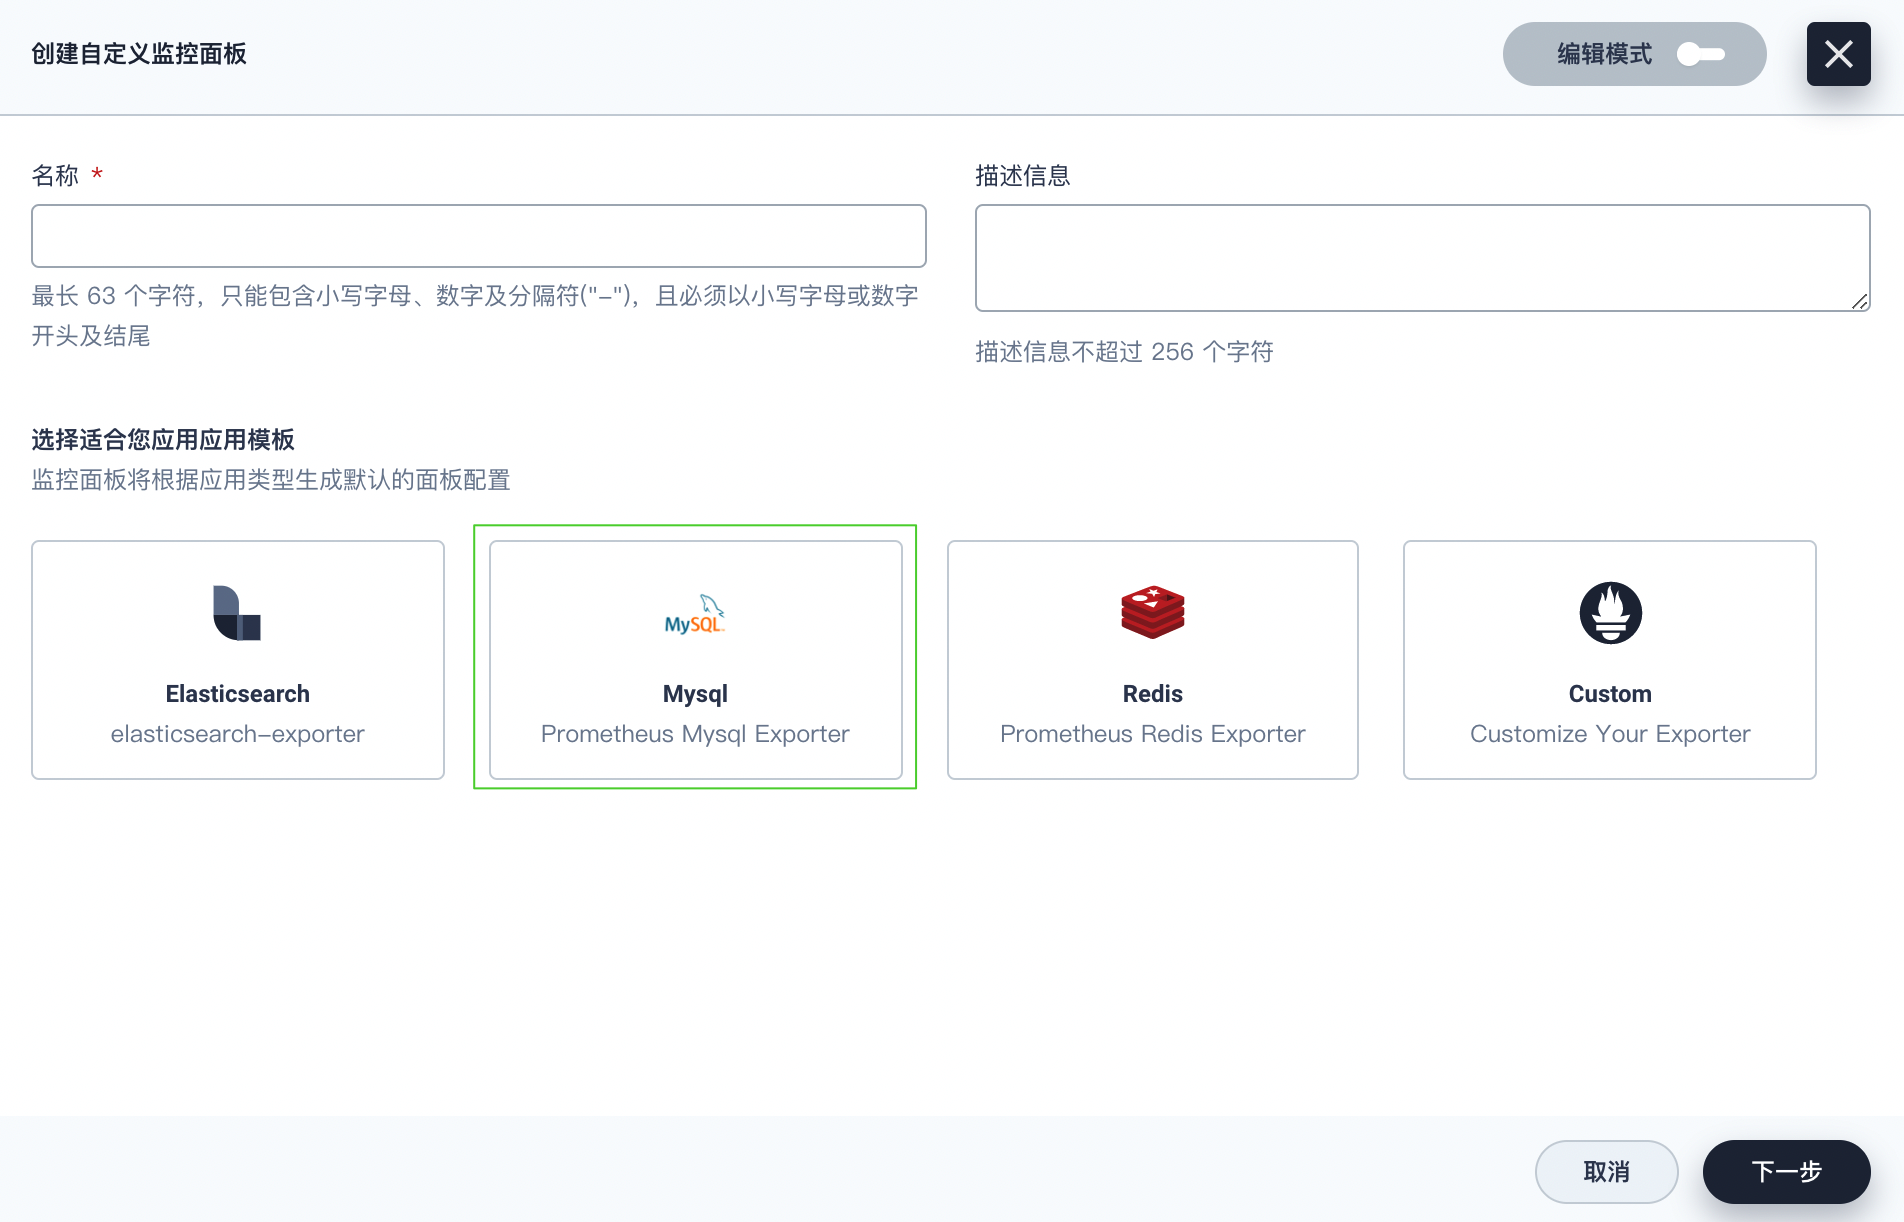
- In the same project, go to Custom Monitoring under Monitoring & Alerting in the sidebar and click Create.
- In the displayed dialog box, set a name for the dashboard (for example,
mysql-overview) and select the MySQL template. Click Next to continue.
- Click Save Template in the upper-right corner. A newly-created dashboard is displayed on the Custom Monitoring Dashboards page.
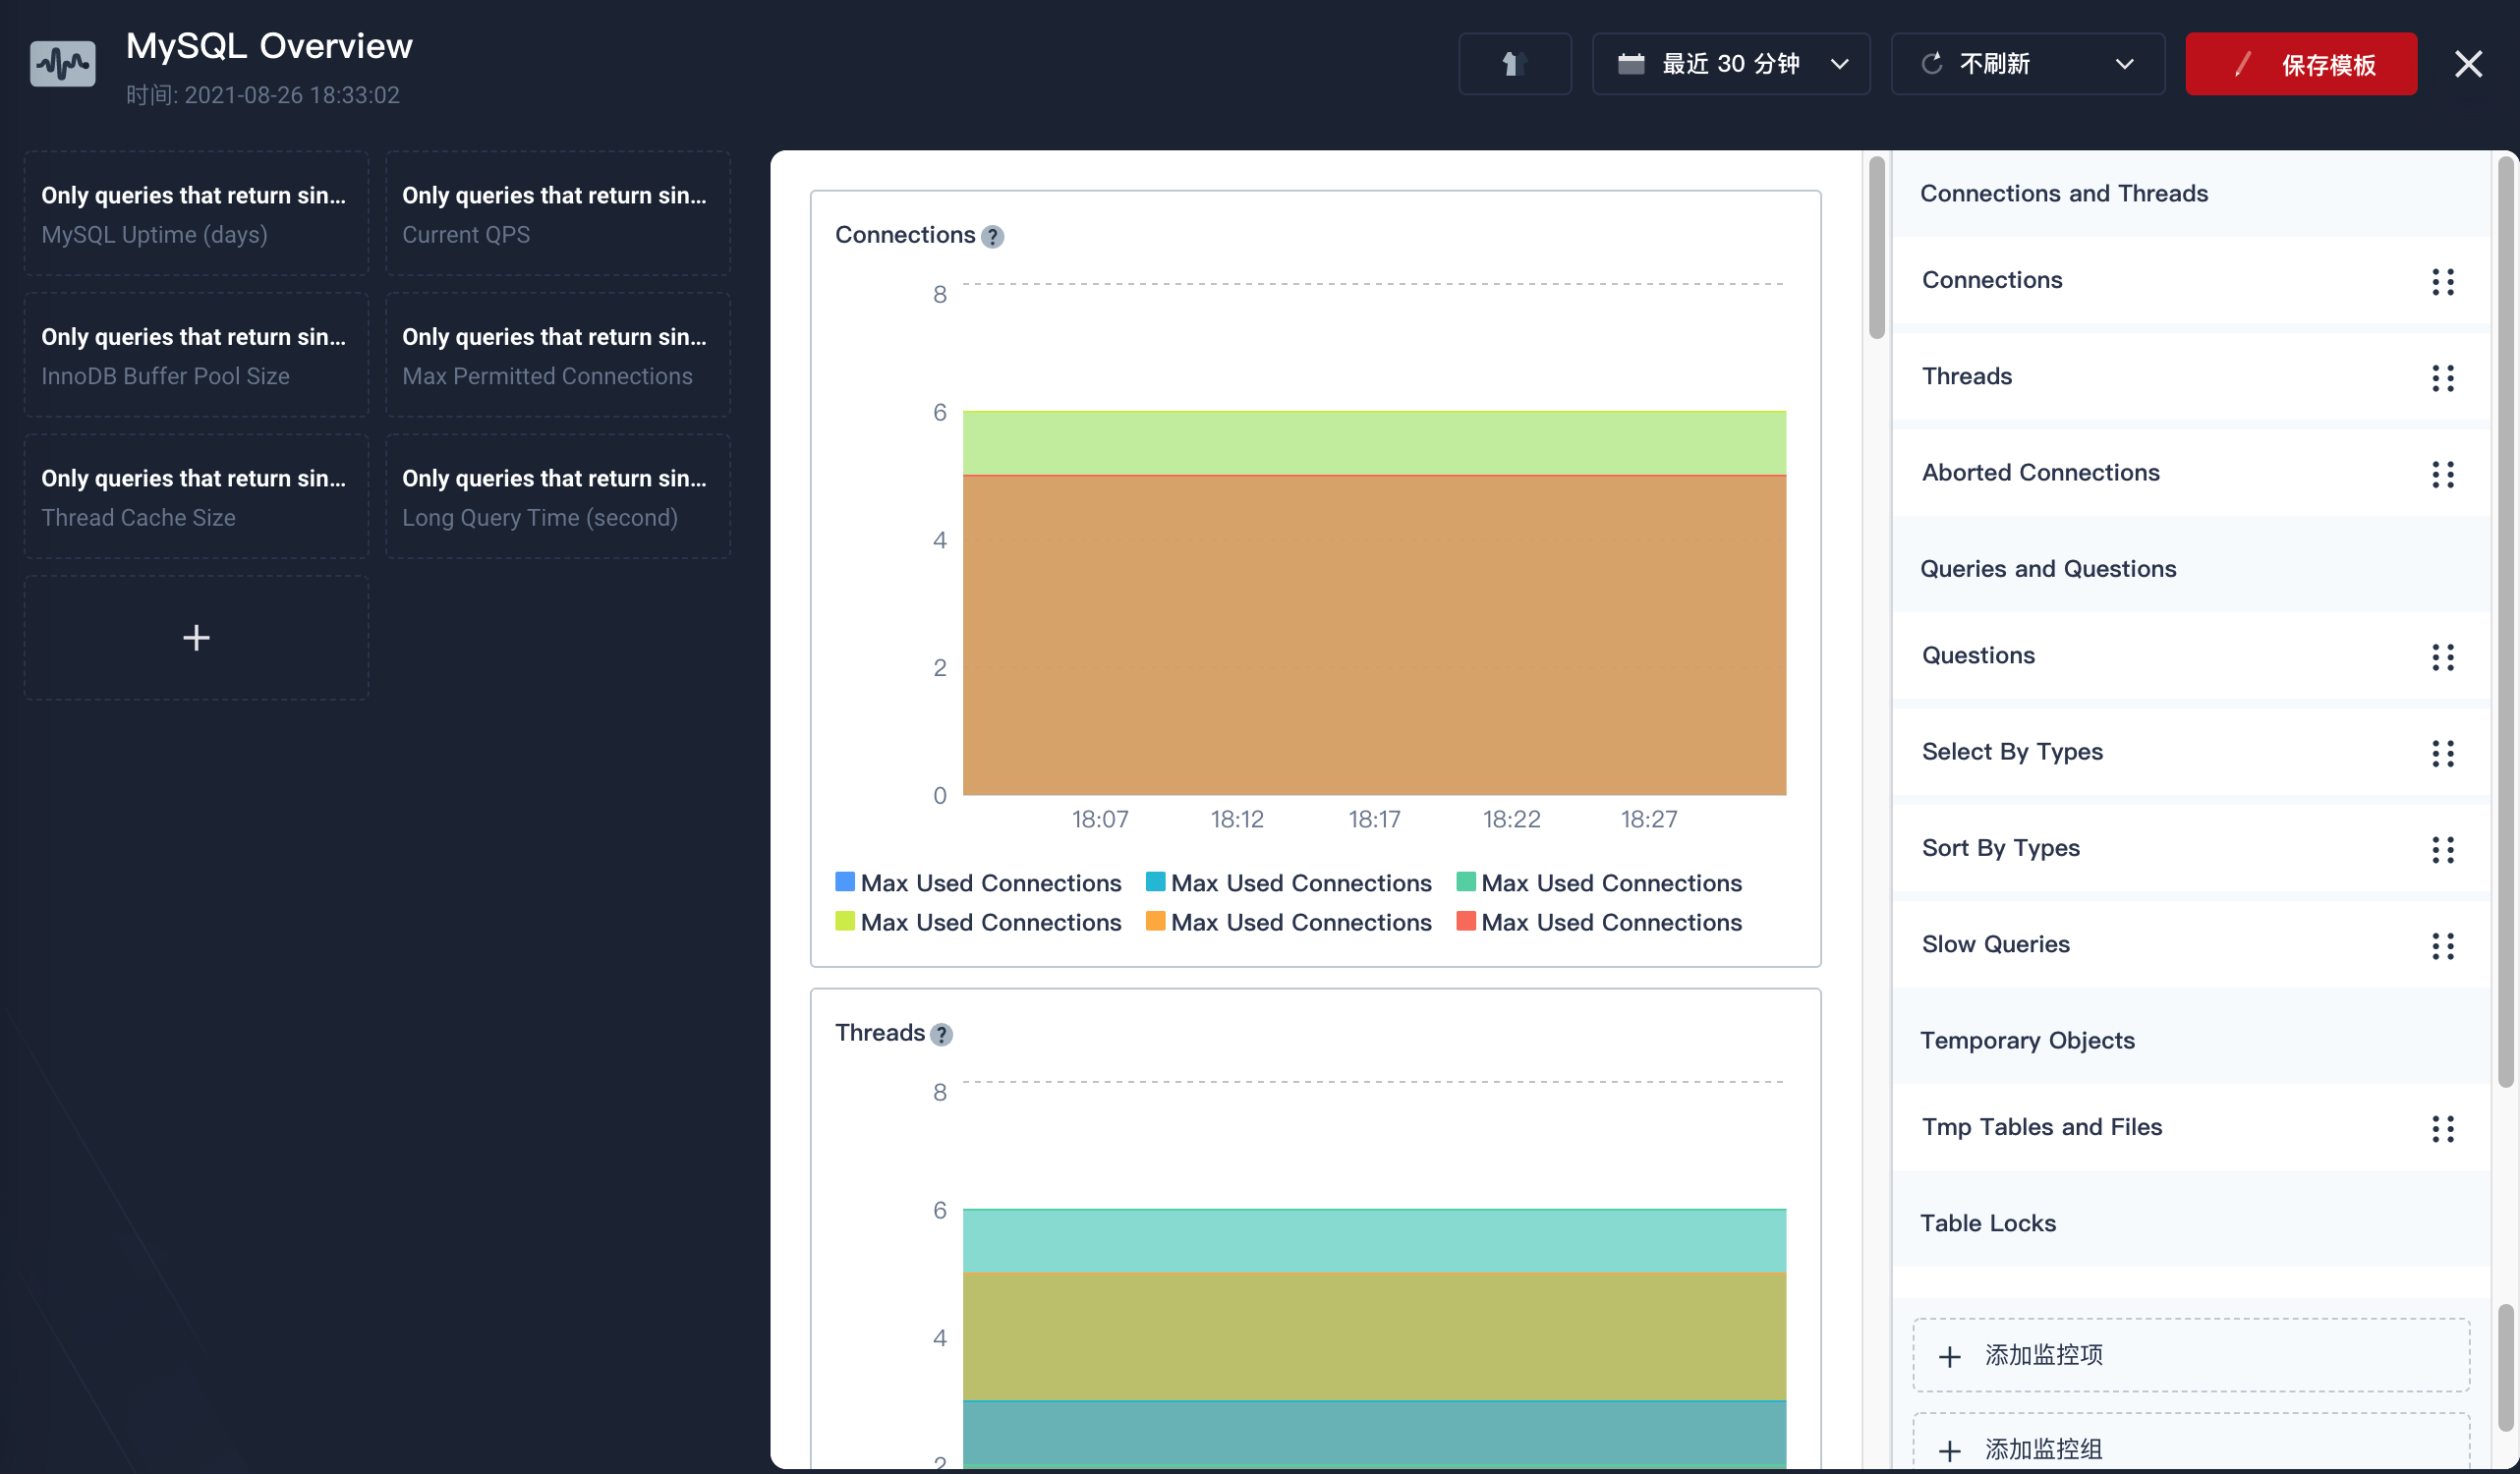
- Wait about ten minutes to view the monitoring data.
For more details, see Kubesphere custom application monitoring and Visualization.
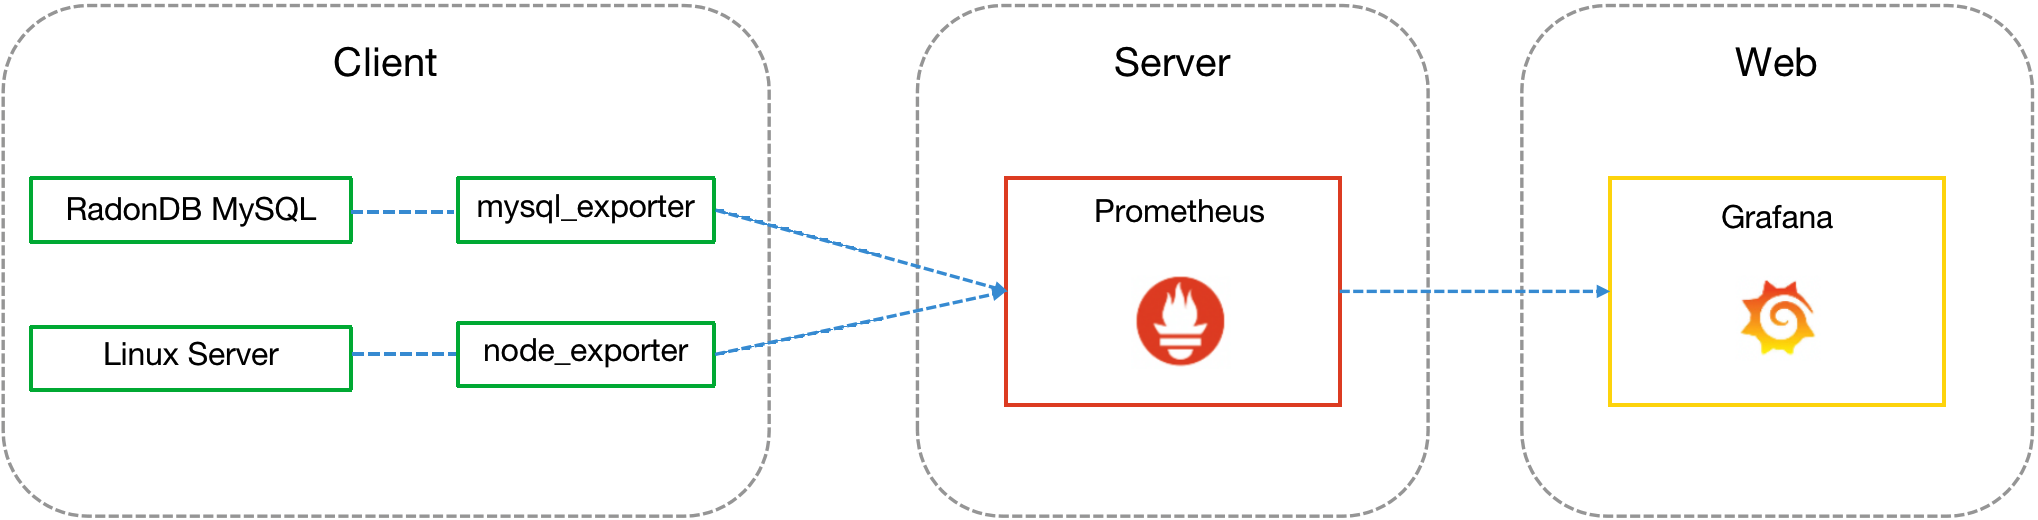
Using Prometheus and Grafana platforms
Grafana is an open-source interactive data-visualization platform. You can use Prometheus and Grafana platforms to view the monitoring information:
- Obtain the monitoring data of RadonDB MySQL services by mysql_exporter.
- Obtain the monitoring data of RadonDB MySQL servers by node_exporter.
- Transfer monitoring data to Prometheus and configure the data source to display monitoring charts and warnings on Grafana.
For more instructions on Grafana monitoring visualization, see Grafana Dashboards.

