Key features

Strong data consistency

Radondb MySQL adopts a primary and multiple secondary databases, and enables automatic split-brain protection.

High availability

Radondb MySQL adopts a primary and multiple secondary databases to meet various availability requirements.

Automatic O&M

You can set strategies for automatic backup, monitoring and alerting, and automatic scaling up.

Elastic scaling

CPU, memory and storage capacity of the database are expanded according to business needs.

Quick start

Architecture

  • Automatic decentralized leader election by Raft protocol
  • Data Synchronization by Semi-Sync replication based on GTID mode
  • High-availability with Xenon

Roadmap

1.0 Helm

  • Cluster management
  • Monitoring and alerting
  • Log management
  • Account management

2.0 Operator

  • Node management
  • Cluster upgrade
  • Backup and recovery
  • Automatic failover
  • Node rebuilding
  • Account management

3.0 Operator

  • Automatic O&M
  • Multiple node roles
  • Disaster recovery
  • SSL encryption

Articles

容器化 | 构建 RadonDB MySQL 集群监控平台
程润科 张莉梅
2022.05.10
上一篇文章我们演示了如何《[在 S3 备份恢复 RadonDB MySQL 集群数据](https://radondb.com/posts/220424_%E5%AE%B9%E5%99%A8%E5%8C%96%E5%9C%A8-s3-%E5%A4%87%E4%BB%BD%E6%81%A2%E5%A4%8D-radondb-mysql-%E9%9B%86%E7%BE%A4%E6%95%B0%E6%8D%AE/)》,本文将演示在 KubeSphere[1] 中使用 Prometheus[2] + Grafana[3] 构建 MySQL 监控平台,开启所需监控指标。 文章结尾附有全部部署过程的演示视频,视频部署版本为 RadonDB MySQL Kubernetes 2.1.3[4]。 # 背景 Prometheus 基于文本的暴露格式,已经成为云原生监控领域事实上的标准格式。 RadonDB MySQL 监控引擎基于 Prometheus MySQLd Exporter[5] 定义。通过 `mysqld-exporter` 抓取 RadonDB MySQL 服务指标,再通过接入第三方应用平台实现监控指标可视化。 # 准备工作 * 已准备可用 Kubernetes 或 KubeSphere 集群 * 已部署 RadonDB MySQL 集群 《[部署文档](https://radondb.com/posts/220224_%E5%AE%B9%E5%99%A8%E5%8C%96-_-%E5%9C%A8-kubesphere-%E4%B8%AD%E9%83%A8%E7%BD%B2-mysql-%E9%9B%86%E7%BE%A4/)》 * RadonDB MySQL Kubernetes 版本 2.1.0+ # 部署步骤 ## 步骤 1: 配置 serviceMonitor `serviceMonitor` 开启后将自动绑定 `mysqld_exporter` 与 Prometheus。 `serviceMonitor` 参数包含如下字段: ```plain serviceMonitor: enabled: true ## Additional labels for the serviceMonitor. Useful if you have multiple prometheus operators running to select only specific ServiceMonitors # additionalLabels: # prometheus: prom-internal interval: 10s scrapeTimeout: 3s # jobLabel: # targetLabels: # podTargetLabels: namespaceSelector: any: true selector: matchLabels: app.kubernetes.io/managed-by: mysql.radondb.com app.kubernetes.io/name: mysql ``` 您可以在 `charts/mysql-operator/values.yaml` 文件中配置 `serviceMonitor`。 * 新部署 Operator 时, `serviceMonitor.enabled` 默认为 **true**,表示默认开启。 * 已部署 Operator 2.1.0 以下版本的集群,需重新部署 Operator。 ## 步骤 2: 配置 metricsOpts `metricsOpts` 是 CRD `mysqlclusters.mysql.radondb.com` 中定义 RadonDB MySQL 集群监控的参数,可通过配置`mysql_v1alpha1_mysqlcluster.yaml` 文件中参数值开启监控服务。 `metricsOpts` 参数包含如下字段: ```plain metricsOpts: enabled: false image: prom/mysqld-exporter:v0.12.1 resources: requests: cpu: 10m memory: 32Mi limits: cpu: 100m memory: 128Mi ``` `metricsOpts.enabled` 默认为 **false**,需手动设置为 **true**。 * 设置 `metricsOpts.enabled` 为 **true**,开启集群监控功能; * 设置资源参数值,定义监控容器资源配额大小; 文件参数修改完成后,使用如下指令应用配置,部署/更新集群回显信息如下: ```bash $ kubectl apply -f config/sample/mysql_v1alpha1_mysqlcluster.yaml cluster.mysql.radondb.com/sample created/configured ``` # 查看监控服务 ## 通过客户端查看 您可以通过如下指令查看集群监控服务和 serviceMonitor 信息。 ```plain $ kubectl get service,servicemonitor $ kubectl describe servicemonitor <serviceName> ``` **预期效果** ```plain $ kubectl get service,servicemonitor NAME TYPE CLUSTER-IP EXTERNAL-IP PORT(S) AGE service/mysql-operator-metrics ClusterIP 10.96.242.205 <none> 8443/TCP 3h25m service/sample-follower ClusterIP 10.96.2.234 <none> 3306/TCP 21h service/sample-leader ClusterIP 10.96.30.238 <none> 3306/TCP 21h service/sample-metrics ClusterIP 10.96.7.222 <none> 9104/TCP 3h24m service/sample-mysql ClusterIP None <none> 3306/TCP 21h NAME AGE servicemonitor.monitoring.coreos.com/demo-mysql-operator 3h25m $ kubectl describe servicemonitor demo-mysql-operator Name: test-radondb-mysql-metrics Namespace: default Labels: app=test-radondb-mysql app.kubernetes.io/managed-by=Helm app.kubernetes.io/vendor=kubesphere chart=radondb-mysql-1.0.0 heritage=Helm release=test Annotations: kubesphere.io/creator: admin API Version: monitoring.coreos.com/v1 Kind: ServiceMonitor ...... Spec: Endpoints: Interval: 1m Path: /metrics Port: metrics Scheme: http Scrape Timeout: 10s ...... ``` ## 在 KubeSphere 平台查看 在 KubeSphere 企业空间部署的 RadonDB MySQL Operator 和集群,开启监控后,可在如下页面查看监控服务状态。 * 在项目空间**应用负载**下的**服务**页面,点击 `<集群名称>-metrics`,可查看监控服务信息。 ![](https://dbg-files.pek3b.qingstor.com/radondb_website/post/220510_%E5%AE%B9%E5%99%A8%E5%8C%96%20_%20%E6%9E%84%E5%BB%BA%20RadonDB%20MySQL%20%E9%9B%86%E7%BE%A4%E7%9B%91%E6%8E%A7%E5%B9%B3%E5%8F%B0%20/image.png) * 在项目空间**应用负载**下的**容器组**页面,点击一个容器的名称,可查看该容器中 `metrics` 资源状态。 ![](https://dbg-files.pek3b.qingstor.com/radondb_website/post/220510_%E5%AE%B9%E5%99%A8%E5%8C%96%20_%20%E6%9E%84%E5%BB%BA%20RadonDB%20MySQL%20%E9%9B%86%E7%BE%A4%E7%9B%91%E6%8E%A7%E5%B9%B3%E5%8F%B0%20/image%20(1).png) # 查看监控内容 ## 通过 KubeSphere 自定义监控 KubeSphere 的监控引擎基于 Prometheus 和 Prometheus Operator。使用 KubeSphere 的自定义监控功能支持以可视化的形式监控 RadonDB MySQL 指标。 1. 在集群同一项目中,选择 **监控告警 -> 自定义监控 -> 创建**; 2. 在对话框中,选择 **MySQL** 模版,并继续配置监控模版; ![](https://dbg-files.pek3b.qingstor.com/radondb_website/post/220510_%E5%AE%B9%E5%99%A8%E5%8C%96%20_%20%E6%9E%84%E5%BB%BA%20RadonDB%20MySQL%20%E9%9B%86%E7%BE%A4%E7%9B%91%E6%8E%A7%E5%B9%B3%E5%8F%B0%20/image%20(2).png) 3. 点击 **保存模版**,即新创建监控面板。 ![](https://dbg-files.pek3b.qingstor.com/radondb_website/post/220510_%E5%AE%B9%E5%99%A8%E5%8C%96%20_%20%E6%9E%84%E5%BB%BA%20RadonDB%20MySQL%20%E9%9B%86%E7%BE%A4%E7%9B%91%E6%8E%A7%E5%B9%B3%E5%8F%B0%20/image%20(3).png) 4. 新建监控面板需等待约十分钟,即可查看监控数据。 ![](https://dbg-files.pek3b.qingstor.com/radondb_website/post/220510_%E5%AE%B9%E5%99%A8%E5%8C%96%20_%20%E6%9E%84%E5%BB%BA%20RadonDB%20MySQL%20%E9%9B%86%E7%BE%A4%E7%9B%91%E6%8E%A7%E5%B9%B3%E5%8F%B0%20/image%20(4).png) 更多详情,请查看 KubeSphere 自定义监控介绍[6] 和 可视化监控[7]。 ## 通过 Prometheus + Grafana 平台 Grafana 是一个跨平台、开源的数据可视化网络应用程序平台。通过 Prometheus + Grafana 平台查看监控基本原理如下: * 通过 mysql_exporter 获取 RadonDB MySQL 服务监控数据. * 通过 node_exporter 获得 RadonDB MySQL 服务器的监控数据。 * 将监控数据传到 Prometheus 后,通过配置数据源,最终在 Grafana 呈现丰富的监控数据图表和警告。 ![](https://dbg-files.pek3b.qingstor.com/radondb_website/post/220510_%E5%AE%B9%E5%99%A8%E5%8C%96%20_%20%E6%9E%84%E5%BB%BA%20RadonDB%20MySQL%20%E9%9B%86%E7%BE%A4%E7%9B%91%E6%8E%A7%E5%B9%B3%E5%8F%B0%20/image%20(5).png) 更多 Grafana 可视化监控使用说明,请参见 [Grafana Dashboards](https://grafana.com/docs/grafana/latest/dashboards/)[8]。 ## 视频部分 <iframe width="760" height="427" src="//player.bilibili.com/player.html?aid=341338001&bvid=BV1SR4y1w7Br&cid=713333319&page=1" scrolling="no" border="0" frameborder="no" framespacing="0" allowfullscreen="true"> </iframe> ## 参考引用 1. KubeSphere:[https://kubesphere.com.cn](https://kubesphere.com.cn) 2. Prometheus:[https://prometheus.io/](https://prometheus.io/) 3. Grafana:[https://grafana.org/](https://grafana.org/) 4. RadonDB MySQL Kubernetes 2.1.3:[https://radondb.com/projects/mysql/](https://radondb.com/projects/mysql/) 5. Prometheus MySQLd Exporter:[https://github.com/prometheus/mysqld_exporter](https://github.com/prometheus/mysqld_exporter) 6. 自定义监控:[https://kubesphere.io/zh/docs/project-user-guide/custom-application-monitoring/introduction/](https://kubesphere.io/zh/docs/project-user-guide/custom-application-monitoring/introduction/) 7. 可视化监控:[https://kubesphere.io/zh/docs/project-user-guide/custom-application-monitoring/visualization/overview/](https://kubesphere.io/zh/docs/project-user-guide/custom-application-monitoring/visualization/overview/) 8. Grafana Dashboards:[https://grafana.com/docs/grafana/latest/dashboards/](https://grafana.com/docs/grafana/latest/dashboards/)
容器化|在 S3 备份恢复 RadonDB MySQL 集群数据
程润科 钱芬
2022.04.24
上一篇文章我们演示了如何快速实现 MySQL 高可用集群部署,以及部署集群的校验和卸载方式。本文将演示如何对集群进行备份和恢复。 部署版本为 [RadonDB MySQL Kubernetes 2.1.3](https://radondb.com/news/220325_radondb-mysql-on-k8s-2_1_3-%E5%8F%91%E5%B8%83/)。 # 环境准备 首先准备一套 Kubernetes 集群,过程略。然后创建一套 RadonDB MySQL 集群。 ## 步骤 1:下载源码 ```plain $ git clone https://github.com/radondb/radondb-mysql-kubernetes.git ``` ## 步骤 2:安装 Operator 以下指定 release 名为 `test` , 创建一个名为 `test-mysql-operator` 的 Deployment。。 ```plain $ helm install test charts/mysql-operator ``` ## 步骤 3:配置备份信息 Kubernetes Secret 资源信息需提前准备。文章及操作视频中的资源环境为青云云平台的 qingstor 对象存储。其他平台的密钥及 S3 存储服务创建过程类似,请另行参考。 ### 创建 API 密钥 登录青云云平台官网,点击 产品与服务 -> API 密钥;进入入 API 密钥页面,点击 创建 API 密钥,输入名称后下载 `s3-access-key` 、 `s3-secret-key` 明文信息。 ### 创建 s3-bucket 点击 产品与服务 -> 对象存储;进入对象存储页面,点击 创建 Bucket,输入 bucket 名称后即可获得 bucket 明文信息: * s3-endpoint: [http://s3.sh1a.qingstor.com](http://s3.sh1a.qingstor.com) * s3-access-key:VNXYHYHQUXZKUVZFGFRY * s3-secret-key:0zw7JKkbAAdlQKHPjTHWtoFGGQRvnQ5SJRc5P69r * s3-bucket: radondb-mysql-bucket s3-xxxx 的值是使用 base64 算法加密的,你可以这样获得。(此处对s3-xxx信息进行脱敏处理)。 ```plain $ echo -n "http://s3.sh1a.qingstor.com"|base64 ``` ### 创建 Kubernetes Secret 资源 创建`backup_secret.yaml`文件用来存放 S3 对象存储相关信息。(此处对s3-xxx信息进行脱敏处理)。 ```yaml kind: Secret apiVersion: v1 metadata: name: sample-backup-secret namespace: default data: s3-endpoint: aHR0cDovL3MzLnNoMWEucWluZ3N0b3IuY29t s3-access-key: Vk5YWUhZSFFVWFpLVVZaRkdGUlk= s3-secret-key: MHp3N0pLa2JBQWRsUUtIUGpUSFd0b0ZHR1FSdm5RNVNKUmM1UDY5cg== s3-bucket: cmFkb25kYi1teXNxbC1idWNrZXQ= type: Opaque ``` 然后在 kubernetes 中执行创建加密配置。 ```plain $ kubectl create -f config/samples/backup_secret.yaml ``` ## 步骤 4:创建及启动集群 请在`mysql_v1a1pha1_mysqlcluster.yaml` 文件中添加 `backupSecretName` 属性。 ```yaml spec: replicas: 3 mysqlVersion: "5.7" backupSecretName: sample-backup-secret ... ``` 执行以下指令,即创建 RadonDB MySQL 集群。 ```plain $ kubectl apply -f config/samples/mysql_v1alpha1_mysqlcluster.yaml ``` # 备份恢复 ## 将集群数据备份到 S3 存储 创建备份文件 `mysql_v1a1pha1_backup.yaml` 内容如下。 ```yaml apiVersion: mysql.radondb.com/v1alpha1 kind: Backup metadata: name: backup-sample1 spec: # Add fields here hostname: sample-mysql-0 clustname: sample ``` |name|function| |:----|:----| |hostname|pod name in cluser| |clustname|cluster name| 待集群运行成功后,执行以下指令开始备份。 ```yaml $ kubectl apply -f config/samples/mysql_v1alpha1_backup.yaml ``` 备份完成后可在 S3 查看对应的备份文件。 ## 从 S3 备份中恢复集群 检测你的 S3 bucket,获取你备份的目录,比如:`backup_2021720827`,并且将设置为 yaml 文件的 `restoreFrom` 属性中。 ```yaml ... spec: replicas: 3 mysqlVersion: "5.7" backupSecretName: sample-backup-secret restoreFrom: "backup_2021720827" ... ``` 此时执行以下指令: ```plain $ kubectl apply -f config/samples/mysql_v1alpha1_mysqlcluster.yaml ``` 恢复完成,已经从名为 `backup_2021720827` 的 S3 备份中恢复一个集群。 # 卸载 卸载过程详见《[部署文档](https://radondb.com/posts/220324_%E5%AE%B9%E5%99%A8%E5%8C%96-_-%E5%9C%A8-k8s-%E4%B8%8A%E9%83%A8%E7%BD%B2-radondb-mysql-operator-%E5%92%8C%E9%9B%86%E7%BE%A4/)》 的卸载部分。 ## 相关视频 实操视频:《[RadonDB MySQL 集群备份恢复](https://radondb.com/docs/mysql/v2.1.3/vadio/%E5%A4%87%E4%BB%BD%E6%81%A2%E5%A4%8D/)》
容器化 | K8s 部署 RadonDB MySQL Operator 和集群
程润科
2022.03.24

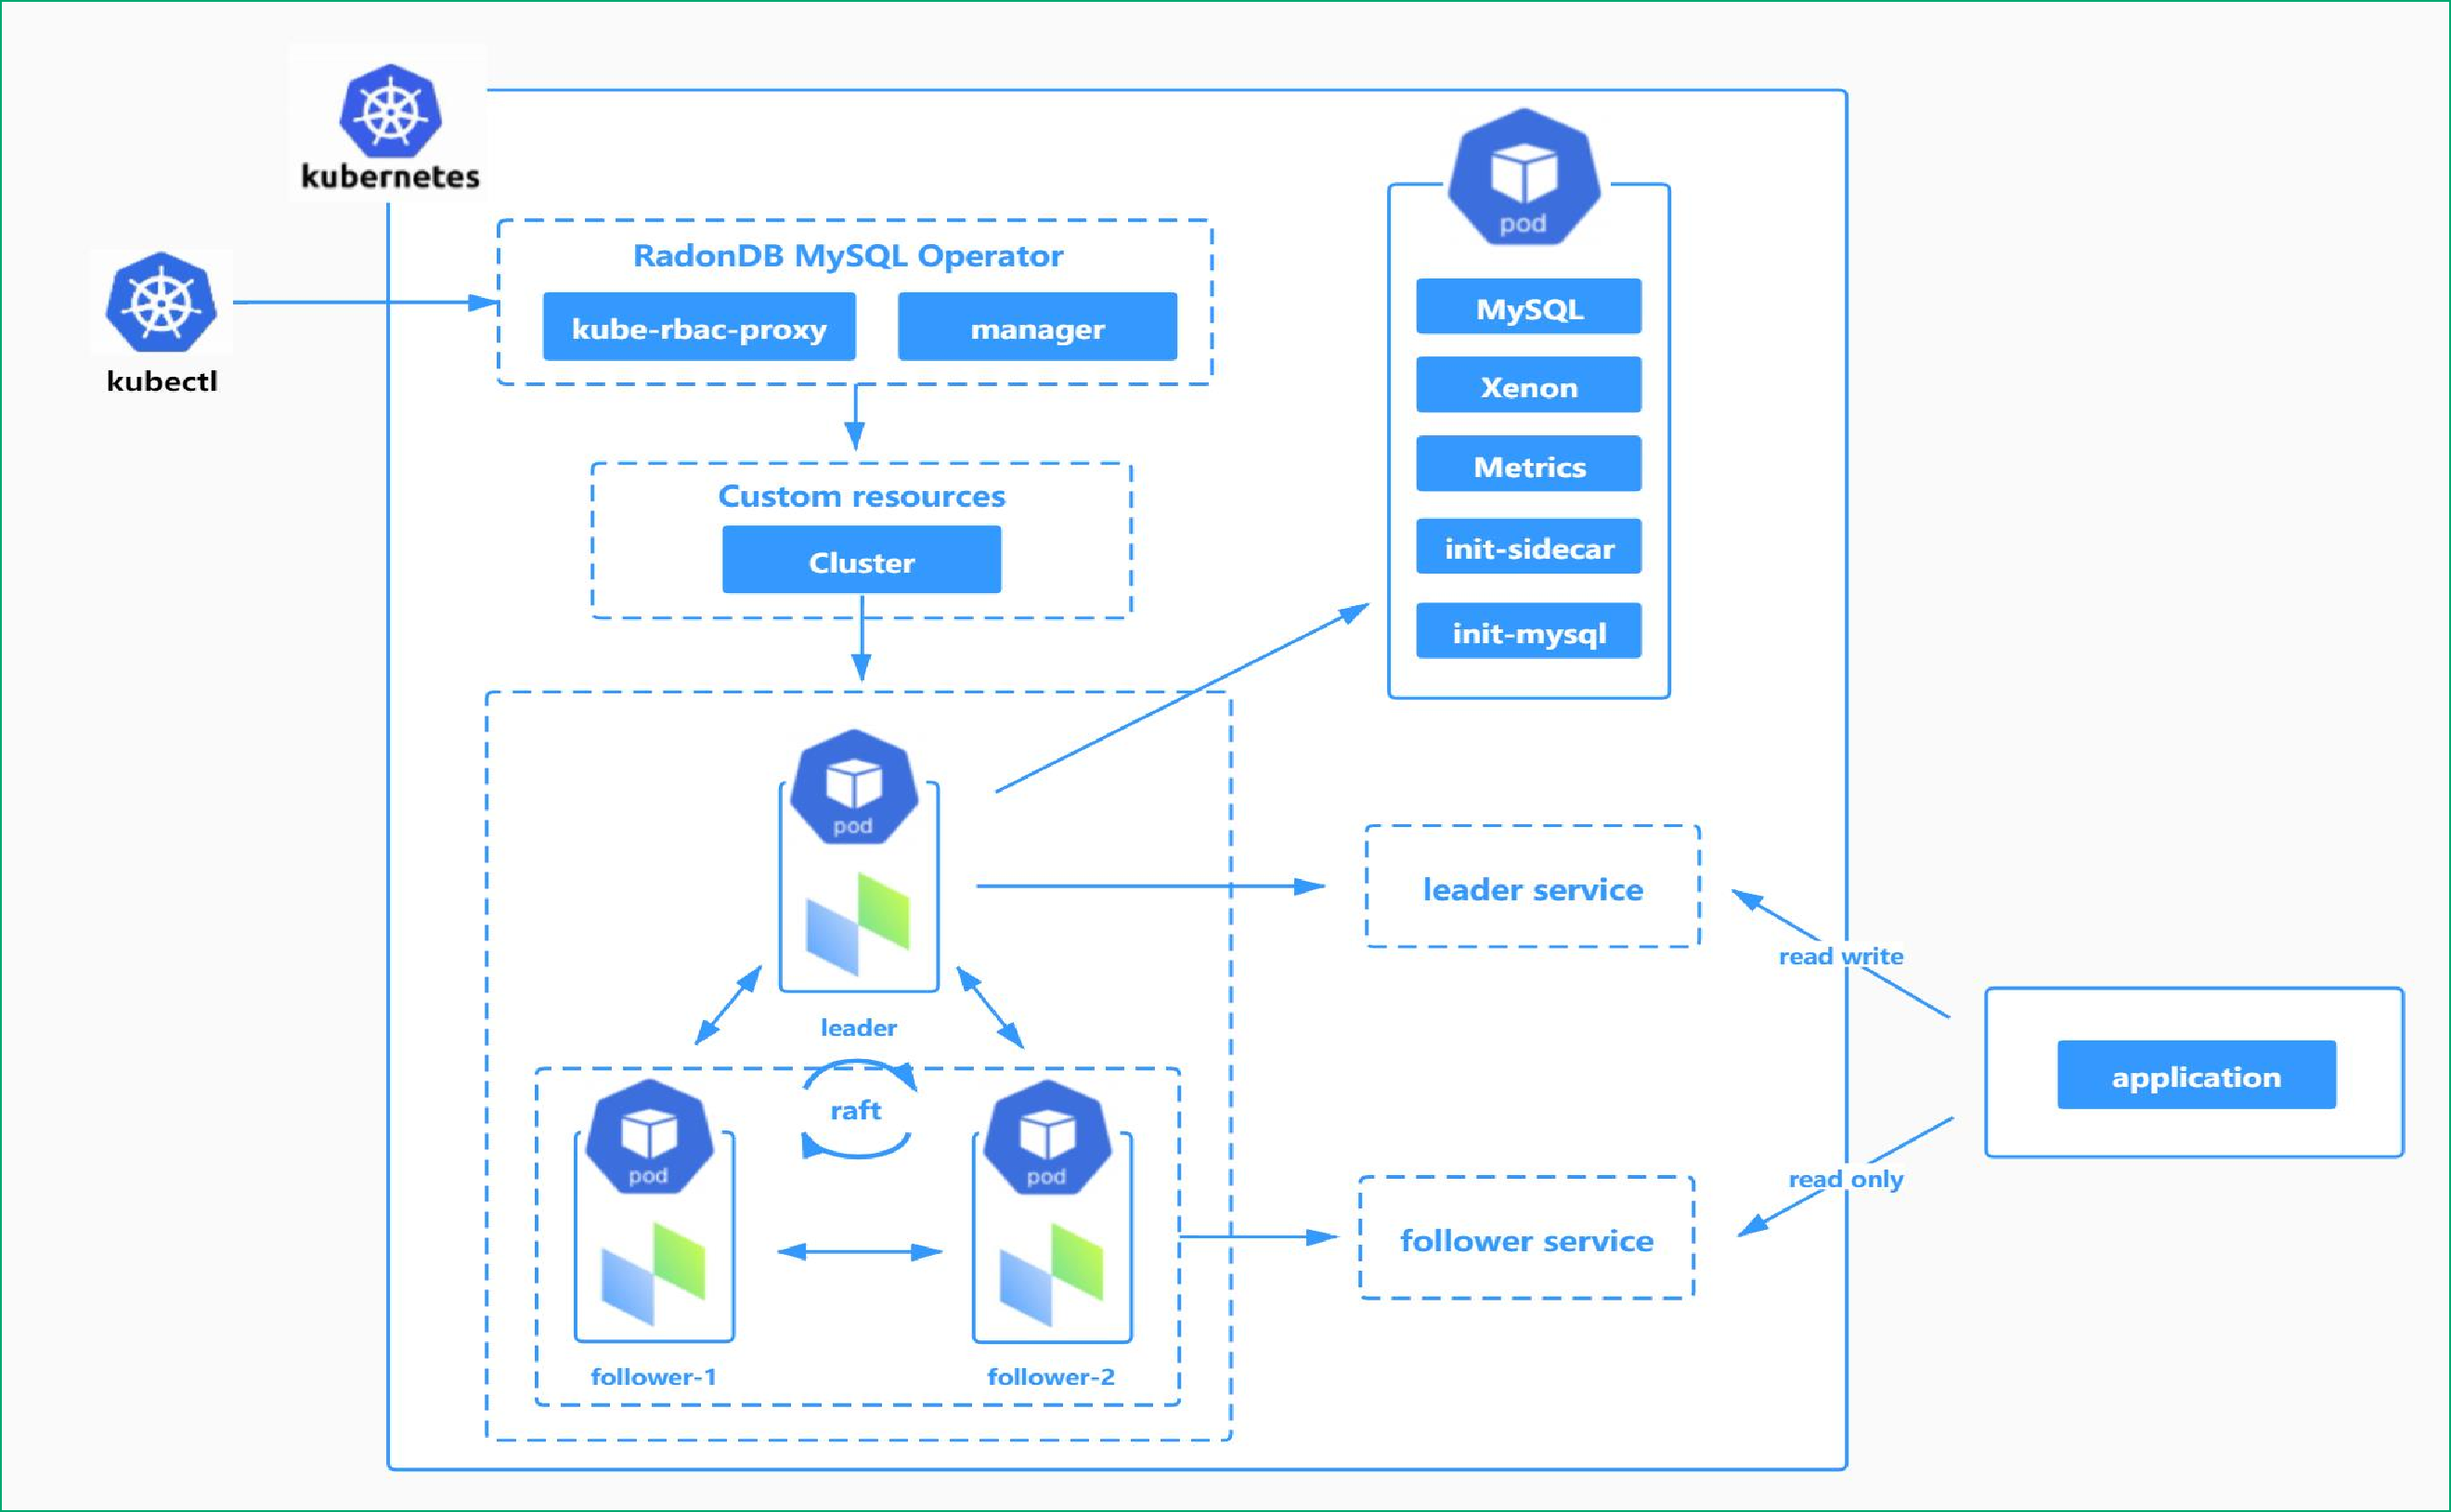
本文将演示如何在 Kubernetes 上部署 RadonDB MySQL Kubernetes 2.1.2